RBB Bancorp (RBB)·Q4 2025 Earnings Summary
RBB Bancorp Beats EPS by 20%, Stock Jumps 5% After Hours as Credit Quality Improves
January 27, 2026 · by Fintool AI Agent
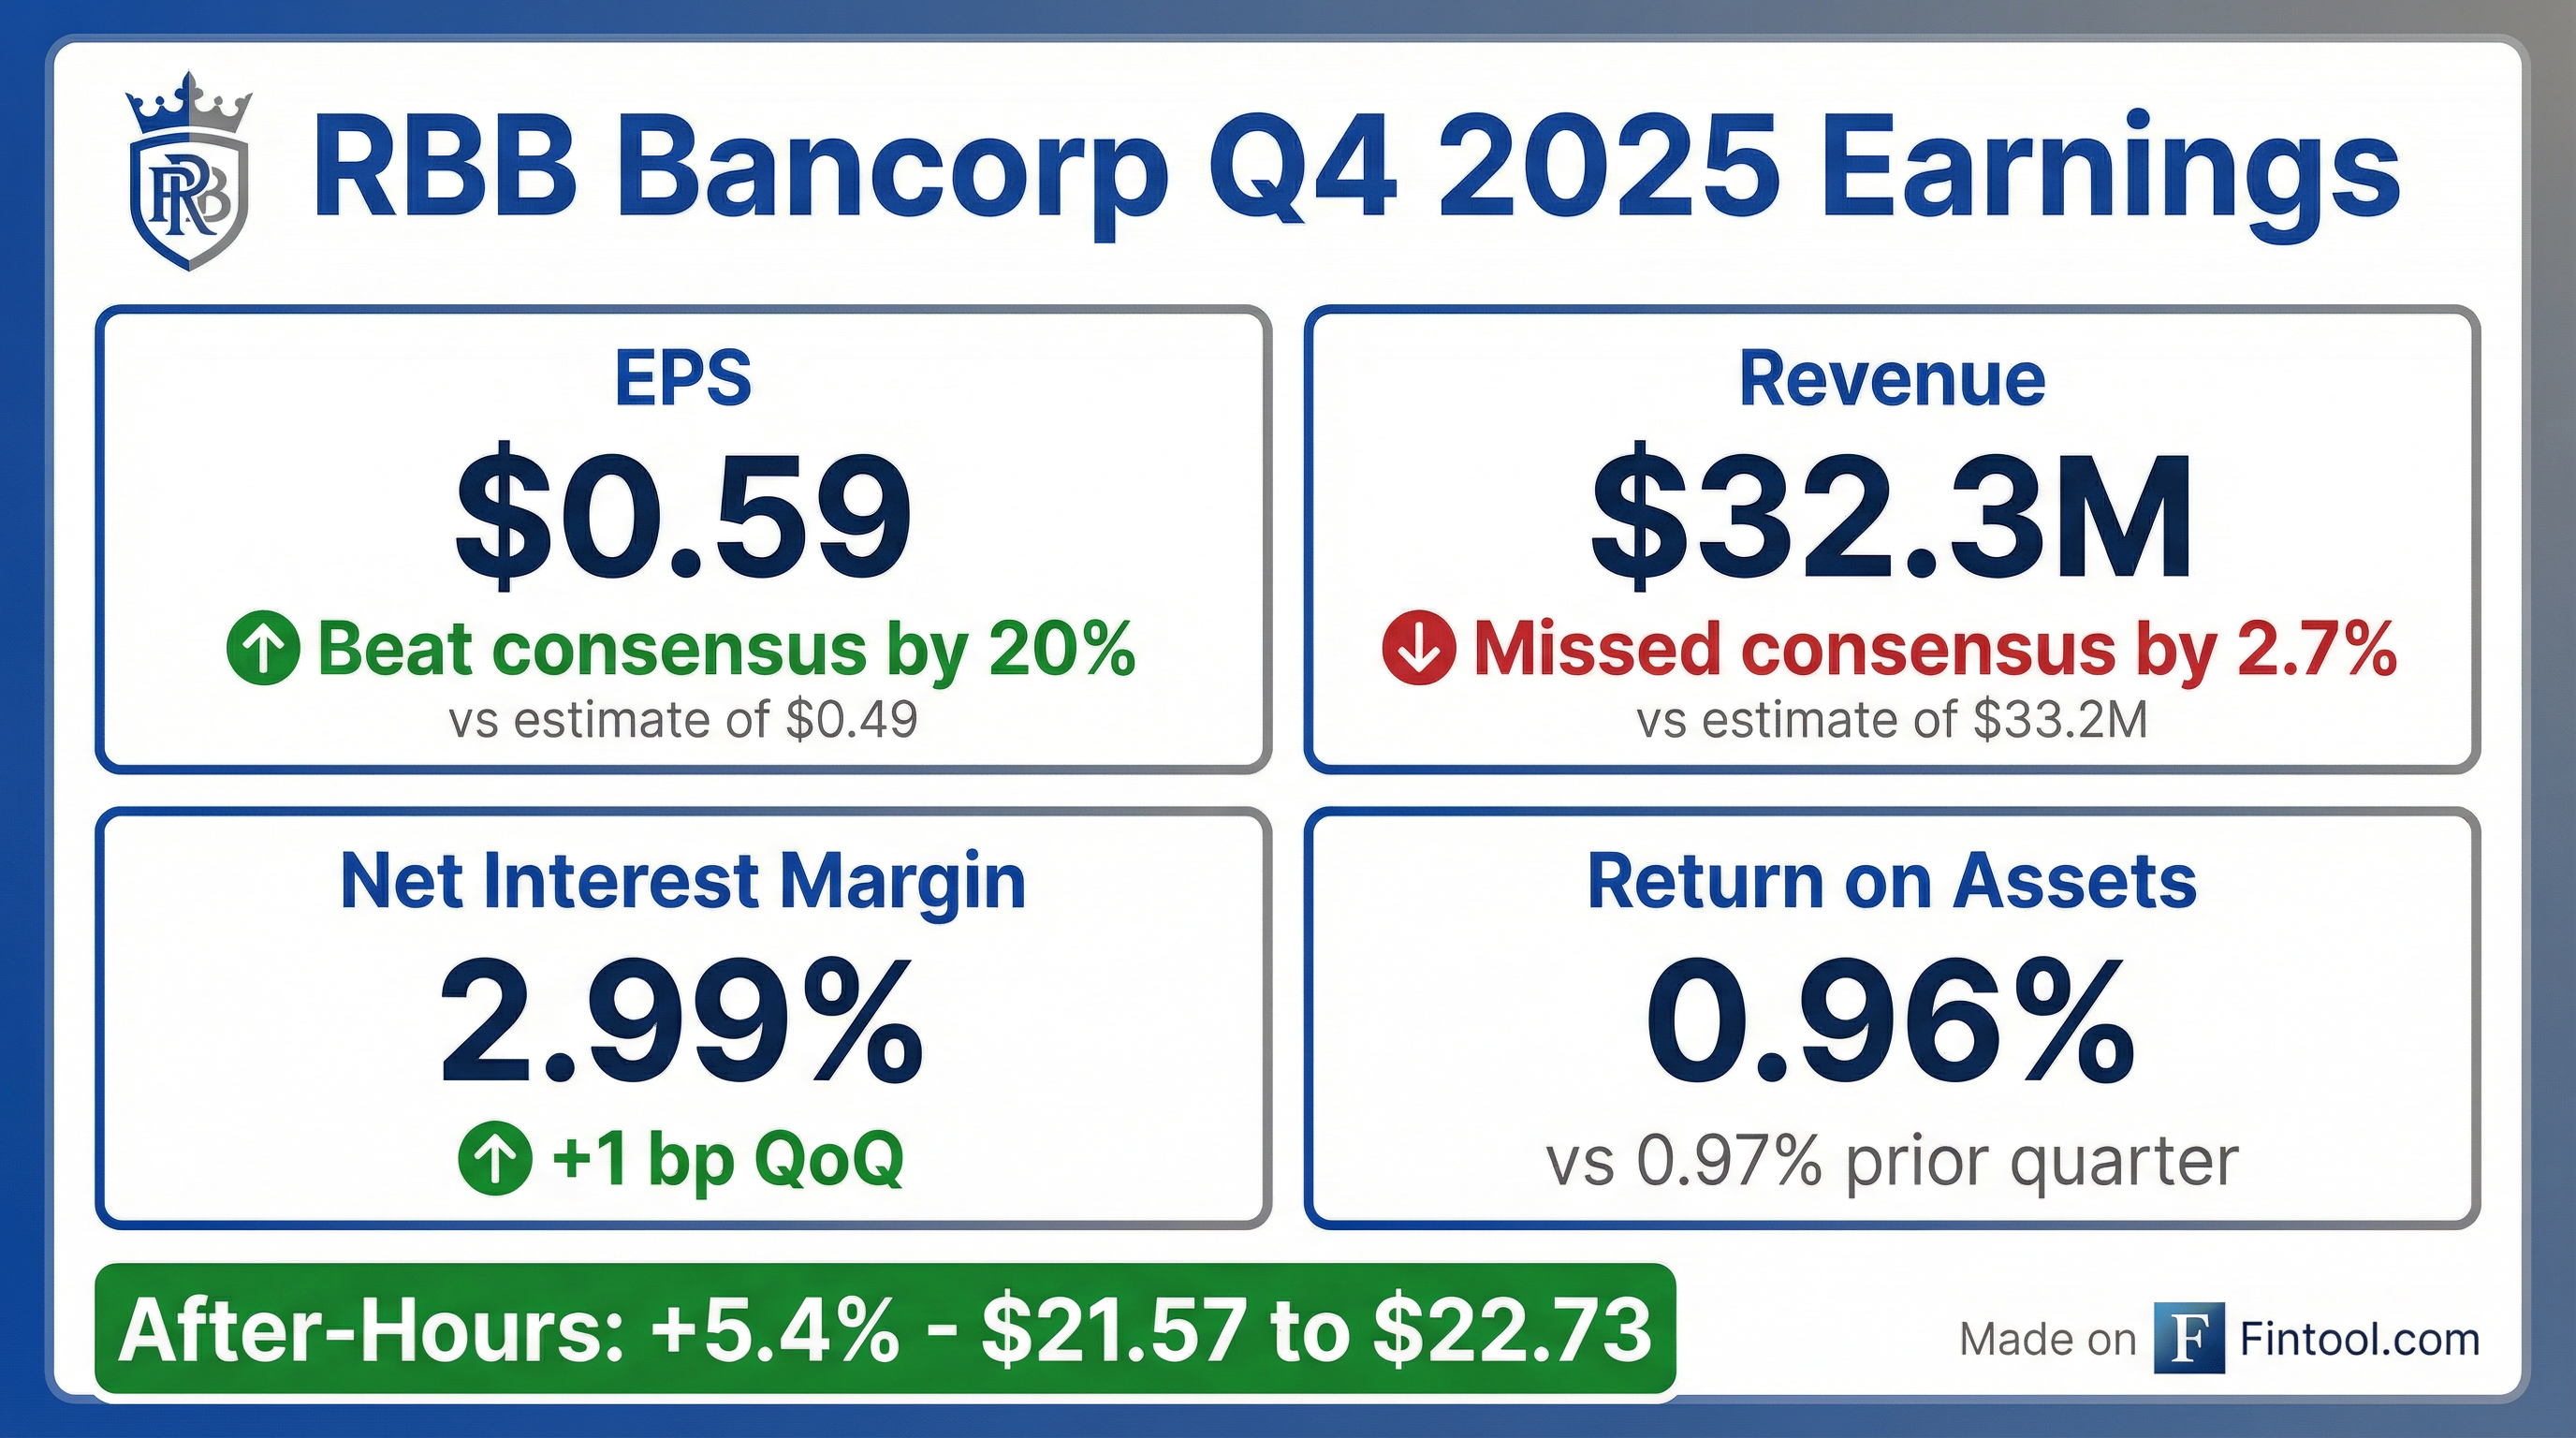
RBB Bancorp (NASDAQ: RBB), the parent company of Royal Business Bank, reported Q4 2025 earnings that significantly topped EPS estimates while modestly missing on revenue. The community bank serving Asian-American communities posted diluted EPS of $0.59, beating consensus by 20%, driven by continued NIM expansion and strong credit quality improvement.
The stock surged 5.4% in after-hours trading to $22.73, reflecting investor enthusiasm for the bank's turnaround from challenging quarters earlier in 2025.
Did RBB Bancorp Beat Earnings?
EPS: Beat by 20% — RBB reported diluted EPS of $0.59 vs. consensus of $0.49, matching Q3 2025 performance and representing a significant recovery from the $0.25 reported in Q4 2024.
Revenue: Missed by 2.7% — Total operating revenue (net interest income + noninterest income) came in at $32.3M vs. consensus of $33.2M. Net interest income was $29.5M, up slightly from $29.3M in Q3.
How Did the Stock React?
RBB shares jumped 5.4% in after-hours trading following the release, moving from $21.57 at the close to $22.73. The stock has been on an upward trajectory since bottoming near $14.40 in mid-2024, now trading near 52-week highs of $22.59.
The positive reaction reflects:
- Consistent EPS delivery ($0.59 in both Q3 and Q4)
- Significant credit quality improvement
- Dividend maintained at $0.16/share
- Return to historical performance levels after a challenging 2024
What Changed From Last Quarter?
Net Interest Margin expanded 1 basis point to 2.99%, benefiting from lower funding costs as the Fed cut rates three times in late 2025. The yield on earning assets declined 7 bps to 5.78%, but the cost of funds dropped 8 bps to 3.04%.
Credit Quality showed meaningful improvement:
- Classified and criticized loans declined $81.2M (-46.2%) QoQ to $94.4M
- Special mention loans dropped $30.1M (-61%) QoQ to $19.2M
- Substandard loans fell $51.1M (-40%) QoQ to $75.2M
- NPAs of $53.5M: 15 NPLs ($44.6M) + 3 OREO properties ($8.8M)
- Net charge-offs normalized to 0.20% of average loans vs. 0.84% in Q3
Loan Growth slowed to $11.7M (1.4% annualized) as originations of $145.0M were largely offset by payoffs/paydowns of $149.3M and loan sales of $26.4M.
What Did Management Say?
CEO Johnny Lee highlighted the strong finish to fiscal 2025:
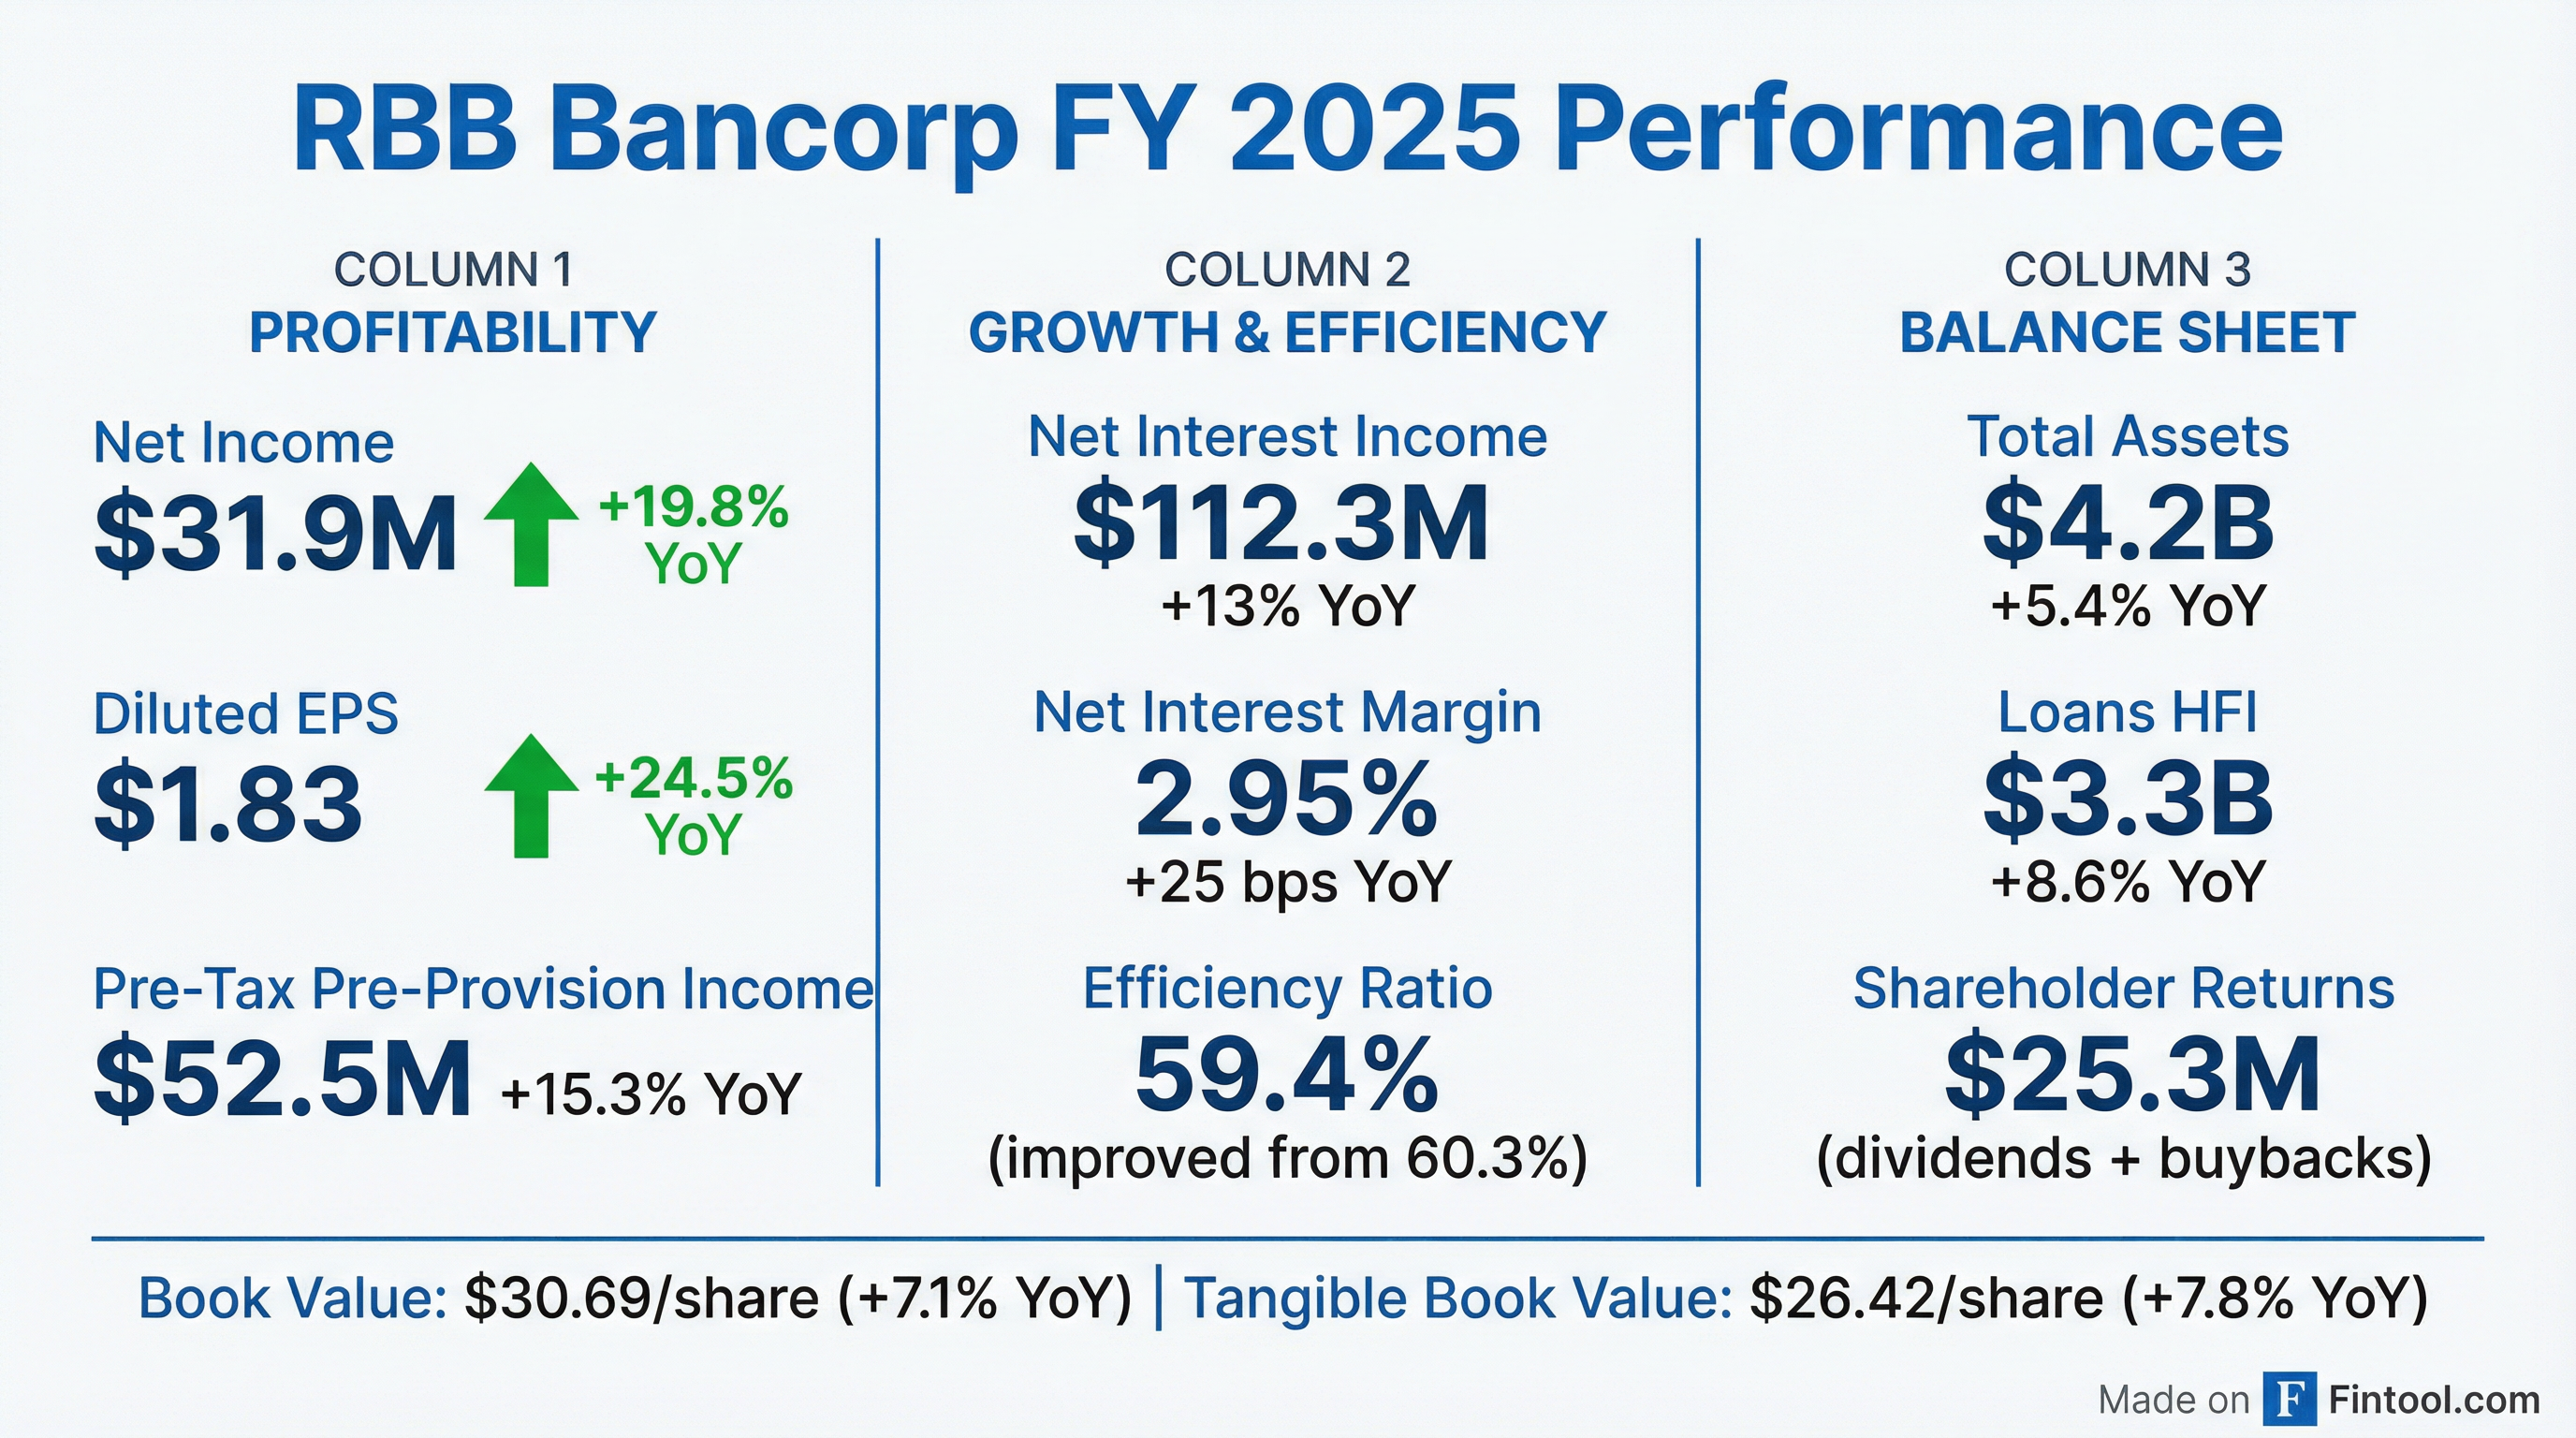
"The fourth quarter was a strong finish to a year with solid loan growth, improving performance ratios, and normalizing credit. 2025 net interest income increased 13% year-over-year and drove return on assets, net interest margin, and earnings per share for the year. I am grateful to the entire RBB team for the work they have done to return the Bank to its historical performance."
Management expressed optimism about continued credit improvement: "We continue to work on resolving our remaining non-performing assets and remain optimistic that credit will continue to improve in future quarters."
Full Year 2025 Performance
RBB delivered strong FY 2025 results, recovering from credit challenges that weighed on performance in late 2024 and early 2025.
Notable FY 2025 items:
- Received $5.2M Employee Retention Credit (ERC) from the IRS, included in other income
- Professional/advisory costs of $1.2M related to ERC filing
- Returned $25.3M to shareholders through dividends and buybacks
Capital & Dividend
RBB maintains strong capital ratios well above regulatory minimums:
Dividend: The Board declared a quarterly cash dividend of $0.16 per share, payable February 13, 2026 to shareholders of record January 30, 2026. This represents a 2.9% annualized yield at current prices.
Loan Portfolio Composition
RBB's loan portfolio is concentrated in real estate, reflecting its focus on commercial and residential lending:
Loan mix: 52% fixed rate, 48% variable rate. The loan-to-deposit ratio was 99.0% at quarter end, up from 98.1% in Q3.
CRE Risk Profile
Given investor focus on commercial real estate risk, here's the detailed breakdown:
Key CRE Risk Mitigants:
- Office exposure minimal at just 2.4% of CRE ($32M), with avg LTV of 47% and 84%+ with LTV <65%
- NY rent-controlled multifamily of $50.1M, 100% with LTV <65%
- All CRE office properties located within primary service areas
Construction & Land Development
C&D loans ($155M) present elevated credit risk:
- Current loans: $127.5M at avg 54% LTV
- Nonaccrual: $28.0M at avg 87% LTV — the highest-risk segment
- Mix: 64% commercial construction, 33% residential, 3% land development
Single-Family Residential Geography
SFR portfolio ($1.66B) geographic distribution:
- New York: 46%
- Southern California: 39%
- Northern California: 7%
- Illinois: 3%
- New Jersey: 3%
- Other: 2%
99% of properties within primary service areas. Avg weighted LTV of 54% with 95%+ of loans at LTV <70%.
Deposit Mix & Funding Costs
Deposit composition at quarter end:
Funding cost trends: Spot deposit rate fell to 2.90% at 12/31/25 from 2.97% at 9/30/25. Liquidity remains strong with cash, investments, and secured borrowing capacity totaling $2.1B.
Operating Expenses
Q4 noninterest expense of $19.0M, up $0.3M QoQ:
Efficiency ratio of 58.7% in Q4, up from 57.4% in Q3 but improved from 61.5% in Q4 2024.
Q&A Highlights
Deposit Repricing Runway
Matthew Clark (Piper Sandler) asked about deposit beta sustainability. CFO Lynn Hopkins provided detailed repricing color:
"99.5% of our $1.7 billion in CDs will mature within the next twelve months, and 40% of those are actually in the first quarter. The average price of those is in the high threes, and funding has come down to probably at the high end around 3.70."
This suggests significant deposit cost relief ahead as CDs reprice into the current rate environment.
Sub-Debt Refinancing
RBB has $120M of subordinated debt eligible for redemption in April 2026 that will reprice to just under 7%. Management indicated they're evaluating options to "rightsize it for our balance sheet and capital stack" at more attractive market rates.
NPA Resolution Timeline
Brendan Nosal (Hovde Group) asked about the credit outlook. Management provided unusually specific detail:
"Our NPLs are well understood. Ninety percent of them are represented by four relationships. Of those four relationships, three of them are continuing to make payments based on agreements... We're really only focused on a few. I think that gives us a really good opportunity to get them worked out during 2026. We're optimistic that will happen in the first half of this year."
The largest NPA is a partially completed construction project representing about half of the NPL balance, which will take longest to resolve.
Loan Growth Pipeline
Kelly Motta (KBW) questioned the slower Q4 loan growth. CEO Johnny Lee explained:
"The pipeline is still relatively healthy right now, both for the commercial and the residential mortgage side... New funded loans for commercial is about $65 million per quarter, and mortgage is about $90 million per quarter. Looking at the pipeline right now, we feel very optimistic we can continue to keep that pace."
CFO Hopkins added the bank is "in as good as, if not better position at the same time last year, when we were able to achieve over 8% annualized growth."
CRE Competition
Tim Coffey (Janney) asked about CRE loan competition. CEO Lee noted:
"Some of our peers are offering five-year fixed rates below 5.75%, at 5.5%-5.75%. But so far we're holding pretty well above at 6% or higher with the yield that we're pricing."
Capital Return Priorities
On the buyback, Hopkins indicated the bank plans to "rightsize the sub-debt, and then return to being more active on a buyback program" — suggesting capital returns accelerate in Q2.
Forward Outlook
Management provided specific guidance for 2026:
Expense Guidance: Q1 expenses expected to increase ~$750K due to seasonal taxes and salary adjustments, then normalize to $18-19M quarterly range. Legal and professional fees expected to moderate as credit issues are resolved.
Tax Rate: Effective tax rate expected to be 27-28% in 2026.
Loan Growth: High single-digit growth expected, with pipeline "as good as, if not better" than the same time last year when the bank achieved 8%+ growth.
NIM Expansion: Management expects continued margin improvement from:
- Deposit repricing (99.5% of CDs mature within 12 months)
- Potential NPA resolution returning $50M+ to earning asset status
- Still "slightly liability sensitive, maybe a bit more neutral than in the past"
Credit Resolution: Optimistic that NPAs will be resolved in H1 2026, with 3 of 4 major NPL relationships already making payments.
Risks to Watch:
- CRE concentration (39% of loans) in a competitive commercial real estate market
- Geographic concentration in California and New York
- Deposit competition keeping pressure on funding costs
- Construction project NPA (half of NPL balance) may take longest to resolve
Key Takeaways
- EPS beat of 20% demonstrates the bank's earnings power as credit normalizes
- Credit quality inflection — classified loans down 25% QoQ, net charge-offs normalized
- NIM expansion continues as funding costs decline faster than asset yields
- Stock up 5% after hours reflects confidence in the turnaround story
- Dividend maintained at $0.16/share (2.9% yield), supported by strong capital
Related Documents: Q4 2025 Earnings Press Release | Q4 2025 Earnings Call Transcript | Company Overview